CS-001 — From Raw Data to Executive Dashboard: Retail Sales Analytics Case Study | DeTLeng
By Muhammad Naveed
Founder of DeTLeng — Data Engineering, ETL & Analytics Solutions
www.detleng.com

🚀 Retail Sales Performance Dashboard
Case Study #001 — End-to-End Data Engineering, Analytics & Dashboard Solution
Transforming 1M+ Retail Transactions into Actionable Business Intelligence
Developed by DeTLeng.com
📖 View Full Interactive Case Study💡 Why This Project Matters
Many retail organizations collect massive volumes of transactional data but struggle to transform that information into meaningful business insights. Without proper reporting and analytics, decision-makers cannot easily identify revenue trends, customer behavior patterns, product performance, or growth opportunities.
This project demonstrates how DeTLeng converts raw operational data into executive-level dashboards that support data-driven business decisions.
🔄 Complete Project Lifecycle
This project followed the same structured delivery methodology used by DeTLeng for Business Intelligence, Data Engineering, Analytics, ETL, and Reporting engagements.
Business Story ⬇️ Data Engineering ⬇️ Analytics Engineering ⬇️ Dashboard Delivery ⬇️ Business Insights ⬇️ Consultation Opportunity
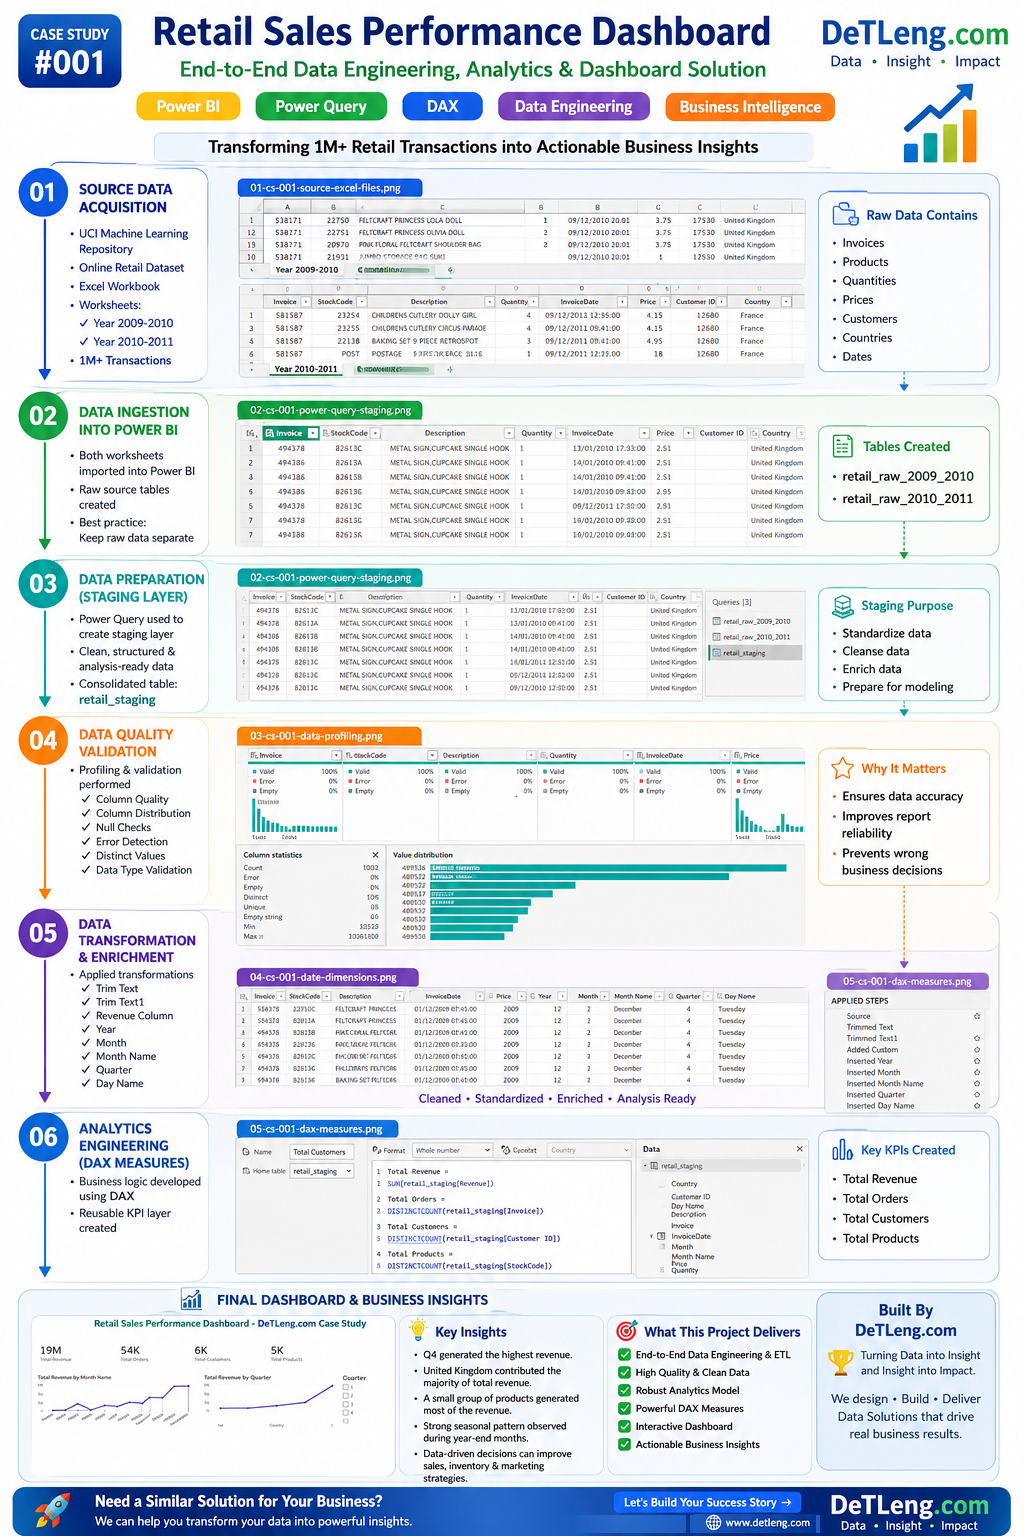
📊 Complete End-to-End Project Infographic
The infographic below visually summarizes the entire project lifecycle from data acquisition to dashboard delivery and business insight generation.
⚙️ Technologies Used
- Power BI
- Power Query
- DAX
- Excel
- Business Intelligence Reporting
- Data Engineering Workflow
📈 What Was Delivered
- Retail Sales Performance Dashboard
- Data Preparation Layer
- Power Query ETL Workflow
- Data Quality Validation Process
- DAX KPI Development
- Executive Reporting Framework
- Interactive Business Insights
🎯 Key Business Insights
- Revenue peaked during Q4.
- United Kingdom generated the majority of sales revenue.
- A small number of products produced a significant share of total revenue.
- Strong seasonal sales behavior was observed during year-end months.
- Interactive filtering enabled deeper regional and product-level analysis.
🏆 The DeTLeng Difference
At DeTLeng, dashboards are not built as isolated reports. We engineer complete analytics solutions that combine business understanding, data engineering, transformation, modeling, analytics, visualization, and insight generation into a single delivery framework.
Every engagement is designed to help organizations move from raw data to informed business decisions faster and with greater confidence.
🤝 Need a Similar Solution?
Whether your project involves ETL pipelines, Power BI dashboards, SQL reporting, data engineering, or business analytics, DeTLeng can help transform your data into measurable business value.
🌐 Visit DeTLeng.com


Comments
Post a Comment